


More often than not, new clients walk into a gym, hire a coach and expect magic to happen. It’s the same with close friends and family members who decided to change their bodies and expect you to become their personal slave. They want to transform into a pro-fitness model overnight. They want it all, and they want it now: “I gained three kilos of weight over the weekend. I’m in my newbie phase; this must be muscle.“
No matter if you’re a professional coach or you just declared yourself ready to comply with helping someone to get in shape, you’ll need to wield the big fat bat of disillusion from time to time. If you’ve got at least some years of experience under the bar, I’m pretty sure you’ll remember at least one occasion when you had to deal with people whose broscience ideology was so deeply ingrained in their brains that you wished the imaginary bat was real. Unfortunately, you can’t always kick them angrily out of the gym, be it because you depend on their fees or because they’re still your friends or relatives. So, what are you going to tell them? How fast does a newbie’s body really change?
In your face!
We know that a beginner’s adaption to resistance exercise is faster than a body that’s already built most of its potential maximum mass after several years of training. They’re even faster than those of a body with just a few months of training (Balshaw, Massey, Maden‐Wilkinson, Lanza, & Folland, 2019). Research gives us a clue of what’s possible within a given timeframe muscle-wise (Nissen & Sharp, 2003). However, studies are often conducted under artificial conditions or samples are not comparable to the average physique athlete. What’s more, you can’t always expect to have clients that stick to your plan with all they’ve got.
In real life, circumstances will never be perfect. In science, it’s assumed that each observation is skewed by an unknown error, which could be inter-individual differences or something else. In my opinion, the best word to describe this error research can’t account for is just “life.” And as something as simple as life can make or break your long-term results in lifting, there’s clearly a need for more real-life data. With this article, I will connect well-established research results and the results of the analyses of a natural athlete’s real-life data. This is a case study of a guy who started from scratch and made it to almost five years of consequent bodybuilding training. There’s no experimental study protocol he needed to follow, no controlled situations, and there haven’t been any observers. Every change in his body composition resembles yearslong learning and developmental process training- and nutrition-wise.
NEW: 3 Questions to Ask Your Client BEFORE Their Next Diet
The guy I’m referring to, let’s call him Jake, meticulously collected bodyweight and nutrition data almost throughout his whole lifting career. He approached me to have a look at his progress in an objective way by “do[ing] whatever’s possible with this pile of spreadsheets” and smacked pages of hand-written logs onto my desk. He started tracking a number of measures only a few months after his first bodybuilding workout. This makes it possible to get an impression of how the body of a (natural) gym newbie can transform realistically. With his friendly permission, I can now share the results and compare them to the scientific evidence.
The key points I could derive from the data are the following:
- The Framework: Training splits, schedule
- Bodyweight: Timeline of bodyweight changes in respect to nutrition
- Bodyweight: Day by day fluctuations of bodyweight
- Recovery: Heart rate
The Framework
Jake isn’t the average beginner, as he already had a history of endurance training of several years before he got into hypertrophy training (starting at 24 years). He also did some bodyweight exercises in conjunction with his ergometer workouts. Jake used to train one-and-a-half hours on his stationary bike every other day for around four years from 2012-2016. He also finished these sessions with push-ups, sit-ups, and the like for another 30 minutes.
At that time, he didn’t care about nutrition and had no idea that eating right might’ve actually helped him to get better results. Still, this puts him into a lot better state physically and discipline-wise than the average gym-newbie might bring to the table. Due to his excessive cardio training, he was already very lean. He was somewhere around 73 kilos at 180 cm (161 pounds at 5 feet 11 inches), but there wasn’t any mentionable amount of muscle he could show off. He may not have had the most optimal prerequisites to start with, but he had a very good base.
In March 2016, he built his first body-part split plan on his own and started to take care of his nutrition. Since then, he followed the very same split until today, only with minor modifications regarding exercise selection. This is a good thing, as the plan was kept constant over the whole timeframe, allowing for increased interpretability of the other dimensions in the equation. Due to his working schedule he trained five days a week on workdays (around 70-100 minutes per session) and left the weekend for recovery as follows:
| Weekday | Foundation | Body Parts |
| Monday | Overhead press | Shoulders, abs |
| Tuesday | Deadlift | Back, hamstrings |
| Wednesday | Bench press | Chest, calves |
| Thursday | Assistance | Biceps, triceps, abs |
| Friday | Squat | Quads, glutes, hamstrings, calves |
| Saturday | Off | Off |
| Sunday | Off | Off |
Most of the assistance exercises were completed in four sets of eight to twelve reps, whereas the big basics were done in the three- to the eight-rep range, pyramiding up and down in weight for three to five sets. He always trained in his garage with minimal equipment (barbell, dumbbells, bench, landmine device; no rack). This limited him to dumbbell bench presses and (back) squats only with the weight he was able to power clean from the floor. Heavy leg work was done via unilateral exercises and barbell hack-squats. Each session started with 20 minutes of cardio (LISS at 200-230 watts) as a warm-up.
He preferred to train early in the morning before heading to the office and, therefore, got up at 04:30 a.m. on weekdays. Jake never missed a single workout; he only took time off during illness or on vacation. In order to deal with early meetings at work or multi-day business trips, he sometimes brought workouts forward or delayed them to Saturday or Sunday. If this wasn’t possible, he even got up at 03:30 a.m. on some occasions. According to his description, he managed to get at least seven to eight hours of sleep on most of the days (bedtime around 08:30-09:00 p.m.).
His approach to calories was a seasonal bulking/cutting scheme, always adjusting calories upwards or downwards in small steps after an evaluation time of at least one week for his current bodyweight. Macros were kept at 2-2.5 grams protein per kilogram bodyweight per day, 10-25 percent of total calories came from healthy fats and the rest was filled up with carbs. Protein was always kept high, independent of the current phase, whereas fats were downregulated only when absolutely necessary. Carbs were the major setscrew for calorie intake. Jake’s meal distribution consisted of six meals per day; most carbs were consumed around his workouts and the biggest meal was saved for the last meal slot of each day. He used whey and casein protein throughout the whole timeframe (~30 grams per portion) and four grams of creatine per day at the end of 2018 (immediately after workouts).
Nutrition
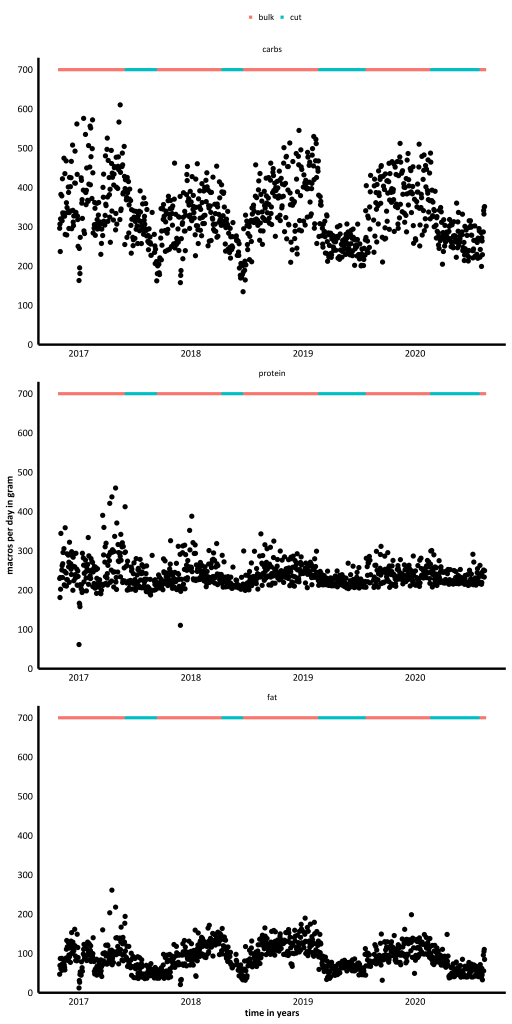
Now, let’s get into the analyses and see what this means nutrition-wise over several years dependent on bulking and cutting phases. In the timeframe from October 2016 to July 2020, the results show Jake’s daily macro distribution. Each data point represents one day, leaving out Saturdays and Sundays when he didn’t track his food. On these off-days, he kept following his routine, but allowed for eating out or occasional cheat meals.
Having a look at figure 1, you can see a visual representation of Jake’s macro distribution as described above: protein was always kept at approximately 200+ grams per day, whereas carbs have clearly the highest variance of all three macros, as they were used as major setscrew to adjust calories up and down. Looking closely, you can spot a few data points below the 200-gram boundary in the protein section of the figure.
At first, I wasn’t sure if those were just measurement errors. But then Jake told me that he had to hug his toilet on those days due to an infection with the infamous Norovirus. He and a few of his friends got infected with that crazy thing at a New Year’s Eve party (January 2017). A similar gastric flu made his body evacuate its interiority several months later at the end of 2017, which explains the low amounts of protein on those four days.
The data points in 2017 also show a much higher variance than those in the rest of the timeframe. Cranking up calories to around 4,000 kcal per day and not having the muscle and activity levels to cope with this huge amount of energy must obviously lead to fast gains in bodyweight (fat).
Bodyweight
Figure 2 shows the change in total body mass over the course of more than four years. Each data point represents one day; there were no missing values. Not very surprising, total calories have a direct influence on bodyweight: the bulking phase in 2017, when the average calorie intake was higher compared to the rest of the whole timeframe, shows a steeper increase in bodyweight compared to the rest of the graph. You can even see a sudden loss in bodyweight for those two weeks when Jake spent more time in his bathroom than he usually does.
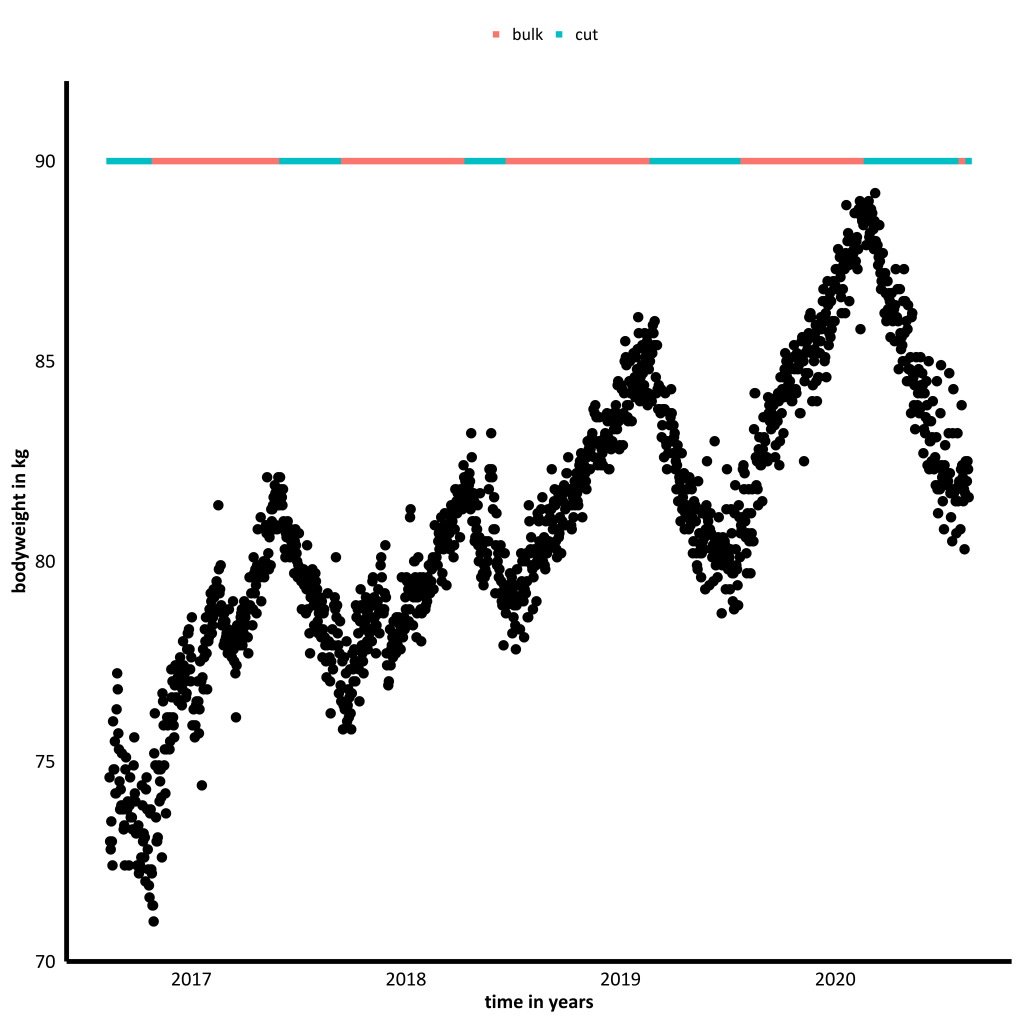
Now let’s have a look at the whole picture: we’re talking about a change of around 20 kilograms total in approximately four years; considering minimum and maximum values of around 70 kg and 90 kg. Unfortunately, I can’t isolate body fat and muscle measures reliable to see the real magic happen, as his bathroom scale always showed approximately the same values of around 40-45 percent lean body mass independent of net muscle gain.
In this case, it doesn’t matter anyway, as it’s actually clear that this weight gain is a mixture of both muscle and fat gain. Looking at the end of the last cutting phase, Jake’s weight settled around 80 kilograms. Assuming that he was in a similar condition in July 2020 and November 2016 (and that he didn’t lose muscle during his latest cut), he has built 10 kilograms of solid muscle, maximum. On average, this is 2.5 kilograms of muscle per year for a newbie over the whole timeframe of around four years.
That’s perfectly realistic! According to a meta-analyses that looked at resistance exercise, various supplements, and gains in lean body mass, a good value considering protein supplementation is an increase in 0.12 percent per week. Creatine supplementation resulted in a net gain in lean body mass of 0.36 percent per week. The training history of the individual samples in the research papers of this meta-analysis hasn’t been controlled, however (Nissen & Sharp, 2003).
Assuming a lean body mass estimate of 43.8 percent according to Jake’s cheap bathroom scale, this means 32 kilograms of muscle mass +0.12 percent-0.36 percent per week. In total, this means 32 kilograms * 1.001252 weeks = 34 kilograms and 32 kilograms * 1.003652 weeks = 38 kilograms; a net gain of 2-4 kilograms per year. This is in line with my findings, but they’re lying on the lower end of this spectrum; be it because of Jake’s history of bodyweight training, creatine supplementation since late 2018 instead of the whole timeframe, or other unknown reasons.
Bodyweight Fluctuations Per Day
Another interesting component I wanted to look at was bodyweight fluctuations from one day to the other depending on bulking and cutting phases. There’s research explaining that glycogen resynthesis and water accumulation can lead to a change of an average of 4.3 kilograms (±1.8 kilograms) over a four-day timeframe with an estimated average glycogen storage of 415 grams (±256 grams) (Kreitzman, Coxon, & Szaz, 1992). In figure 3 you can see what I found in Jake’s data.
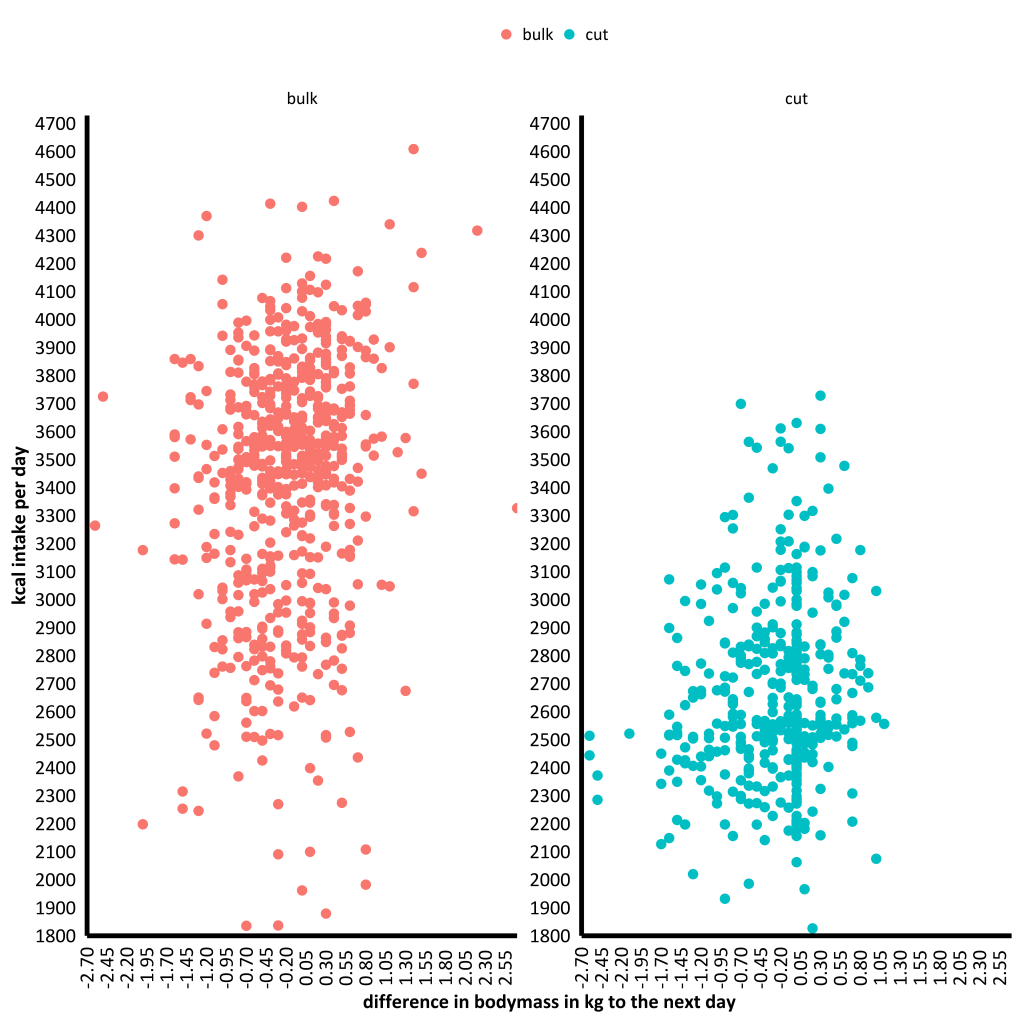
As you can see, there’s a range of around ± 2.5 kilograms Jake’s bodyweight fluctuated per day. It’s also interesting to see that calorie intake’s only minimally correlated with these fluctuations. The real reason for those changes is carb loading, water retention, and probably mere food mass. Similar to muscle growth, Jake only scratches the lower end of the values research provides.
Recovery
Finally, I wanted to see whether there was a measurable effect in Jake’s heart rate dependent on his recovery time. He logged both his average and maximum heart rate during his warm-up on the ergometer for each training session. I used these data as a reference of his ability to recover from training, as shown in figure 4 in form of a boxplot.
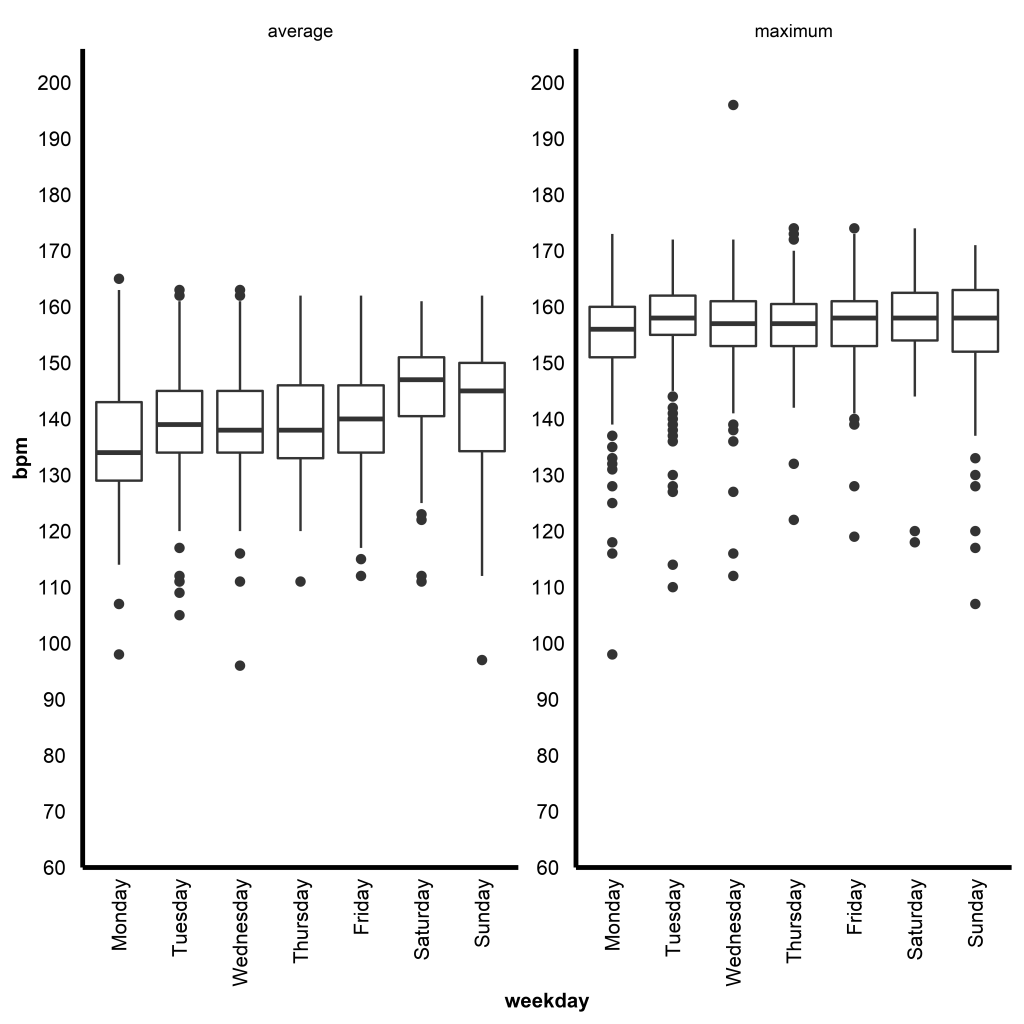
Not paying attention to random and accidental outliers (the black dots), you can see that both the lowest average value (horizontal black line in the boxes) of average and maximum measures occurred on Mondays (statistically significant, p < .05). Jake’s heart didn’t have to work as hard as on the other days in the very same task under the very same stress. This can be explained by the preceding rest days on Saturdays and Sundays. Not only do they entail muscle repair, two days off of heavy lifting with sustained creatine supplementation led to full creatine storage. This was shown to positively affect the oxygen cost of an activity, subsequently reducing the work the cardiovascular system has to perform (Nelson, et al., 2000). The not-so-surprising conclusion: off-time works for recovery.
What’s also worth mentioning, is that the highest average values can be found on sessions that fell on Saturdays and Sundays, with less impact on maximum values. However, not all comparisons between the weekdays and the weekend were statistically significant. I suppose there’s a carryover effect from heavy leg days on Fridays.
What Can You Learn From Jake?
This case study shows us that real-world results can be close to research, but they don’t really match the point. Despite the existence of the infamous newbie gains, you already knew that they’re hardly as fast as some gym newbies may believe. However, now you’ve got some real-world evidence that growth may not even be as “fast” as science makes us believe.
Other outcomes of this case study, such as bodyweight fluctuations, also showed the same trend. With good to very good prerequisites, why didn’t Jake progress faster? We can now speculate if Jake could’ve achieved more in the same timeframe by changing some variables, but that’s not what he did. Thus, the answer can only be: he had no controlled study protocol he needed to follow, no sterile experimental framework and there was a very long timeframe we’re looking at. From the scientific work, I can tell you that it’s a horrendous task to make a representable and big enough sample stick to controlled experimental conditions for such a long time. In short, there are always drawbacks that make such a study less comparable to the real world.
In Jake’s case, there was a lot of “life” going on, which makes this little long-term report fit your situation a lot better than actual research results. So, what’s the take-home message then? Research can be useful to get an impression of what you can expect. But it isn’t always doing well in accounting for the randomness of everyday life. Don’t always pull out the science card when arguing with your coach. Yearslong experience with hundreds of clients might be a thing, huh?
References
- Balshaw, T. G., Massey, G. J., Maden‐Wilkinson, T. M., Lanza, M. B., & Folland, J. P. (2019). Neural adaptations after 4 years vs 12 weeks of resistance training vs untrained. Scandinavian Journal of Medicine & Science in Sports, 29(3), pp. 348-359.
- Kreitzman, S. N., Coxon, A. Y., & Szaz, K. F. (1992). Glycogen storage: illusions of easy weight loss, excessive weight regain, and distortions in estimates of body composition. The American Journal of Clinical Nutrition, 56(1), pp. 292S-293S.
- Nelson, A. G., Day, R., Glickman-Weiss, E. L., Hegsted, M., Kokkonen, J., & Sampson, B. (2000). Creatine supplementation alters the response to a graded cycle ergometer test. European Journal of Applied Physiology, 83(1), pp. 89-94.
- Nissen, S. L., & Sharp, R. L. (2003). Effect of dietary supplements on lean mass and strength gains with resistance exercise: a meta-analysis. Journal of Applied Physiology, 94(2), pp. 651-659.

Alex Loder is a certified work and organizational psychologist from Austria, Europe, and works at university as a data scientist since 2016. In 2020, he graduated from an interdisciplinary doctoral program with a focus on psychology and sports science. Since 2020, he also teaches statistics in the higher education field for master’s degree candidates. In addition to his job, Alex is currently enrolled in an advanced studies program (Leadership) and simultaneously works on a research project for his future habilitation (qualification for a professorship in Austria).