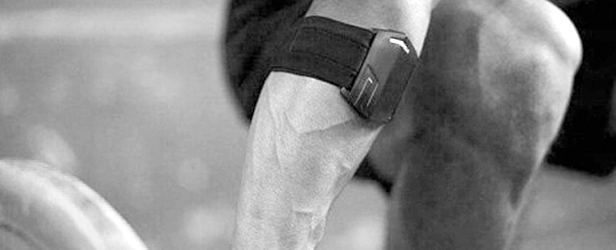
Many of you may know about PUSH by now, especially since Carl Valle has mentioned the PUSH system in a number of recent posts. For those of you who have heard of PUSH, you probably associate us with velocity based training (VBT). Although that is very true, PUSH has a whole lot more to offer than just velocity tracking. This post will highlight some of the theory behind VBT (for those trying to learn more about it), but we’ll also expand and give you other great features of PUSH.
Overview
Our core metrics include velocity and power - but more metrics are available both on the mobile app and the PUSH Portal. Table 1 provides an outline of PUSH’s core metrics - and more are on the way.
Table 1 - PUSH Metrics
How PUSH Does It
The PUSH Band is an armband capable of capturing movement from a wide variety of resistance exercises - including Olympic lifts, traditional lifts, plyometrics, med ball exercises, and kettlebell exercises. Each exercise has it’s own unique characteristics, and each are analyzed separately to ensure that the outputs are both consistent and accurate. Based on these characteristics, PUSH counts every rep you make and displays the data on a smartphone or tablet (Figure 1).
Figure 1 - Post-Set Screenshots

I know what you’re thinking, but what about if I want to know the speed of the bar? Our developers use kinematic analyses for every exercise to extract metrics based on the point of reference that’s most important. Let me give you an example - during a clean, it’s more important to know about bar speed than the speed of your center of mass. With the band being worn on the forearm, PUSH is able to accurately predict bar speed. In contrast, for power during a clean, it’s relevant to know what’s going on with the entire system (body + bar).
How Do Coaches Use VBT?
Velocity is known to be a good indicator of neuromuscular fatigue, which is why many coaches, like Bryan Mann (Missouri) and Ryan Podell (Flyers), use velocity to autoregulate the loads that their athletes are training with. If you’re using a traditional percent-based training (PBT) approach, you may actually be targeting a quality that wasn’t on your radar. Look at Figure 2 below - we’ve seen the force-velocity curve before but instead of using percentages for each training quality, coaches can now use velocity zones.
Figure 2 - Force-Velocity Curve

Let’s use Johnny as an example. Johnny is a collegiate football player, in-season and his training goal is to maintain his power output (or strength-speed) as best as he can. His pre-season 1RM for bench was 350 but now that he’s in-season, there’s no way he can do a 1RM test and risk getting injured. Johnny ends up using his pre-season numbers to dictate his bench press loads - for power, he’s doing 70% of his 1RM which is 245. We all know that his 1RM is probably on a slow decline as the season continues to roll and without getting some sort of biometric feedback, we really don’t know if Johnny is training the appropriate quality. At 245, he may be moving that bar way too slow. With velocity, if you see Johnny’s numbers dipping below the 0.75m/s mark (according to Figure 2, for example), you know it’s time to decrease the load and keep the bar moving fast. Alternatively, if he’s had a couple days off, feeling rested and had a pre-workout boost, he may blow past 1.0m/s - time to increase the load today Johnny (Figure 3).
Many coaches use this form of autoregulation to ensure their athletes aren’t at risk of overtraining and to target the appropriate training quality.
Figure 3 - Velocity when you’re out of range
Two Other Creative Ways to Use Velocity Feedback
Improve Strength and Maintain Speed
It’s obvious that when you’re increasing the amount of load that you can lift from one week to the next, it equates to increases in strength. That being said, you’re not always certain if the jumps in load are appropriate or not (i.e. am I still working the intended quality or am I merely grinding through sets). For instance, if in week 1 I can deadlift 315 and that increases to 340 by week 5, that means I gained strength right? Well, what if the goal was circa max strength (or submax strength) - notice that the velocity zone for that quality is 0.35m/s-0.45m/s. Sure, I may have increased my ability to deadlift but at what cost? Perhaps my velocity was very slow and not relevant to my goal.
Try this instead - set a zone for your athlete depending on the training focus and each week, try to adjust the load to stay in that velocity zone. Even if the increases in load aren’t massive, the long-term gains will outweigh that drawback.
Maintain Your Load, Improve Your Speed
In most sports, speed is the name of the game. That’s why there’s been such a push to use velocity based tracking devices - how else can you tell if your athletes are moving weight faster?
Try this - get your athlete to add load to a speed focused exercise, like a power snatch for example (the load should be heavy enough to provide a good stimulus). Now, maintain that load and aim at increasing the speed of the bar from one week to the next. Obviously, once the speed plateaus - which probably won’t occur for a number of weeks - you’ll increase the load and go through the process again.
These are just a few ways you can use velocity in your training sessions. Coaches can be creative but it’s critical to stick to your training principles.
Power Works Too
Why can’t researchers pinpoint the ideal loads to use when trying to optimize power output? Because each athlete is different - some athletes have more strength dominant qualities and may produce higher power outputs with heavier loads while other athletes may have more elastic abilities and their highest power outputs occur at lighter loads. Research continuously gives us the 30%-80% recommendation - even with a keen eye, coaches will have a difficult time optimizing power without biometric feedback. So how do you use power? I recently attended the Speed/Power conference, hosted by the Canadian Athletics Coaching Centre. Legendary coach Henk Kraaijenhof was one of the main presenters. Henk spoke about this topic of power and I’ll use his insights to provide some guidance.
Establish a Power-Curve
Take a look at figure 4 - here’s a look at power output during a bench press at various relative intensities. Henk tests his athletes at different loads before he puts them through a program. He then takes the highest values at each of these loads - as this represents the ‘capacity’ of the athlete to generate max power - and plots them. Henk re-tests his athletes periodically to make sure that what they’re doing in the weight room is actually making an impact.
Figure 4 - Power-Curve Pre and Post Training
 The 10% Rule
The other way Henk does it is by looking at percent drop offs from the first rep of a set to the last rep or from one set to the next. Look at figure 5 - on the 7th rep, there was more than a 10% drop off from the first rep, meaning, he would cut that set at that point. Table 2 shows the average power from one set to the next, if in one of the sets, there is more than a 10% drop off from the first set, the athlete will move on to another exercise (or finish the session).
Figure 5

Table 2

“Speed is speed, no matter what the sport or the athlete. When you increase speed, you increase power” - Henk Kraaijenhof
Well said.
Three More Useful Ways to Use PUSH
Load-Velocity Profiling
Similar to the power-curve above, establish a load-velocity profile for your athletes. Mladen has done this with his athletes and has written extensively on the topic. Look at figure 6 - establishing a load-velocity profile for an athlete gives you insight into their speed generating qualities at different loads. This may be important as no two athletes are exactly the same - think principle of individuality. Now although the F-V curve that we displayed earlier is a great start, it doesn’t account for differences in height, fiber type, elastic abilities etc. Coaches can re-test their athletes after a training block to see if the line has moved up and to the right - meaning, the athlete can lift more load at a given velocity.
Figure 6 - Load Velocity Profile Pre and Post Training

Estimating 1-RM
We all know that performing 1-RM tests can be tough. Some reasons include insufficient time to perform 1-RM tests regularly, not getting accurate results as certain athletes aren’t comfortable/capable of getting pushing themselves with max loads - which could also predispose them to injury. Not to mention that 1-RM fluctuates on a daily basis depending on the athlete’s training phase, time of the week, their sleep from the night before etc. At PUSH, we’ll be rolling out a new feature very soon that will enable coaches to use submax loads with their athletes to predict a 1-RM for that exercise on that particular day. Research suggests that this may be more accurate than using 6RM or 10RM tests - not to mention it won’t fatigue your athlete. A typical protocol with PUSH will look something like this:
Figure 7 - PUSH 1-RM Protocol
![]()
Using Total Work (J) to Track Training Volume
We’ve all seen Selye’s stress-adaptation-supercompensation model. But it’s hard to know how much stress we’re actually imposing on an athlete. As coaches, we’ve tried different methods - volume load (VL), time under tension, sRPE x time (which gives you a training load [TL] metric for your session) etc. Volume load has probably been the most popular method but are you telling me that if I do a power clean at 185 and a bench press at the same load - and for the same amount of reps and sets (hypothetically speaking) - that the same amount of stress is acting on the body? I certainly don’t think so. There’s a lot more going on during a power clean than a bench press (more joints at play, greater muscle activation etc.) but VL would not reflect this. Similarly, if 2 athletes are doing the same load, reps and sets for a particular exercise, but one athlete is moving the load a greater distance (because of more range of motion or he’s taller), work (J) would be a better indicator of stress than VL. Essentially, work looks something like this:
Work = Force x Displacement
This is a simplistic way of describing work but it provides an idea of what’s at play. PUSH considers the force exerted by the athlete, as well as the eccentric and concentric (summation) distance that is done during a rep.
PUSH Helps Coaches Do More Coaching
Many coaches, especially at the collegiate level, have hundreds of athletes under their tutelage. Designing, analyzing and re-evaluating their programs can be time-consuming, taking away teaching time between the athlete and coach. Our mission, to allow coaches to get more floor time by speeding up some of these processes. The PUSH Portal and PUSH Team are here to do just that.

Portal and Team System Features
- Coaches can review detailed metrics for each of their athletes. This includes a session summary looking at every rep they performed in their last workout as well as longer-term performances that can be scaled to pinpoint specific time frames during a season.
- Coaches can create template workouts, turn those into specific sessions/routines, and push those routines to individual athletes or groups (Figure 8). Once the athlete logs into their profile on the Team System (Figure 9), their routine automatically populates.
- Every rep of every set is recorded. We even have a manual entry mode for exercises that we don’t yet track - coaches can add their specific exercises on the portal and these will also display in the athletes profile. No more paper and pen, just a simple, seamless workflow.
- Coaches can export data and perform their own analyses. This helps to establish force-velocity curves for athletes, compute other metrics like EUR (eccentric utilization ratio), RSI (reactive strength index), jump height etc. to establish baselines and monitor fatigue.

Four Ways Your Athletes Benefit from PUSH
- Competition: Athletes are competitive in nature. Show them numbers, and they’ll try to beat their training partners. The training environment is heightened - rather than just going through the motion, every rep is all of a sudden heightened.
- Motivation: From set to set, session to session and week to week, athletes will be able to visually see all of their outputs. Coaches can isolate the areas that are most important for the athlete and show their progress in that area. There are other ways to show progression (or regression) than simply basing it off of training loads.
- Cognitive Arousal: In S&C friend of mine said that when his athletes press the PUSH button to begin their set, it flips a switch for them and puts them in a sort of ‘zone’. They are more focused and ready to roll.
- Readiness: Perhaps the most important factor - tracking key metrics over the course of a season will provide valuable feedback into the the athlete’s fatigue state. This information can be relayed to the coaching staff and may play a vital role into their decisions on how much gametime that athlete should have.
Developing Explosive Athletes: Velocity Based Training eBook
Push Band
Matt is currently the Lead Sport Scientist at PUSH. Matt's aim is to educate athletes and coaches on the benefits of velocity based training – a method based on autoregulation. Matt completed his MSc degree in Strength & Conditioning from the University of Edinburgh in 2012 where he concentrated his research on the ability to increase power and speed through plyometric training. Prior to PUSH, Matt was a WTA (Women’s Tennis Association) strength & conditioning coach and also worked with a number of young athletes across a variety of sports both at the collegiate and junior levels in Canada and the UK.







2 Comments